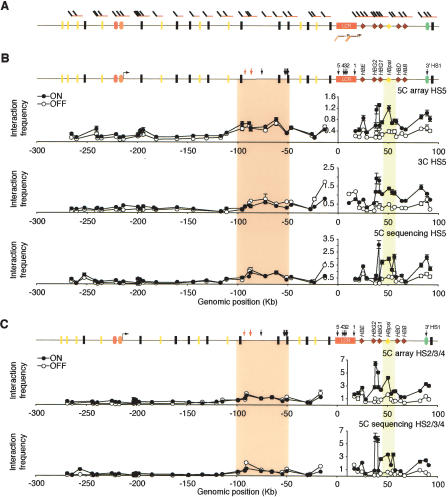
Figure 4.
Large-scale 5C analysis of the human β-globin locus. (A) Positions of forward (top) and reverse (bottom) 5C primers within the β-globin locus. (B) Chromatin interaction profile of HS5 with a 400-kb region surrounding the LCR. Physical interactions in K562 (ON) and GM06990 (OFF) cells were measured by 5C and microarrays (top), 3C (middle), and 5C and quantitative sequencing (bottom) analysis. The β-globin locus illustrated above the profiles includes features described in Figure 2A. The forward-facing arrow indicates the location of an alternative ε-globin transcription start site. Light and dark orange ovals represent the Ubiquilin 3 (UBQLN3) and MGC20470 hypothetical genes, respectively. Arrows indicate HSs identified in K562 cells. Red arrows indicate HSs identified in K562 cells that have been proposed to be orthologous to HS-62.5/-62.0 in the murine locus (Farrell et al. 2002; Bulger et al. 2003). (C) Chromatin interaction profile of HS2/3/4 of the LCR with the 400-kb region around the LCR as determined by microarray (top) and quantitative sequencing (bottom). Colored vertical bars highlight the interactions between the LCR and upstream HSs and the γ–δ intergenic region.

