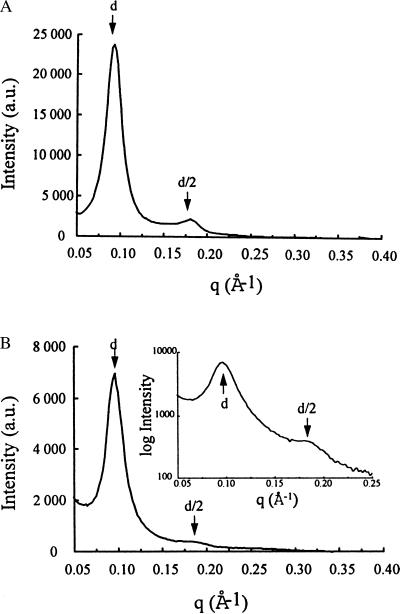
Figure 3.
SAXS scans of BGTC/DOPE–DNA lipoplexes from zone C (A) and of BGTC-DNA lipoplexes from zone C (B); in the Inset, the log of the scattering intensity is plotted as a function of the momentum transfer q. d and d/2 correspond to the first reflection and the second order reflection, respectively.

