FIGURE 2.
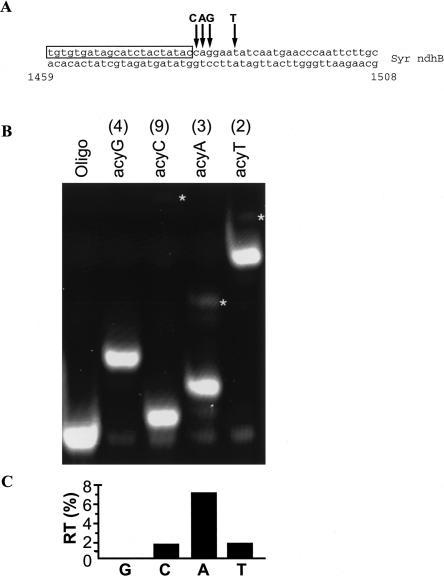
Effect of base choice on run through. (A) Map of relevant Syr ndhB sequence used as a template for the assay. Primer sequence is boxed. Arrows indicate the first instance of each base. (B) Fluorescence scan of a polyacrylamide gel containing assay products of Syr ndhB unedited plasmid template using different acyclo bases. Numbers in parentheses above lanes are the number of bases to the second instance of the respective bases (run through; marked by asterisks on gel). (C) Quantified percent run through (RT) for each base.

