FIGURE 3.
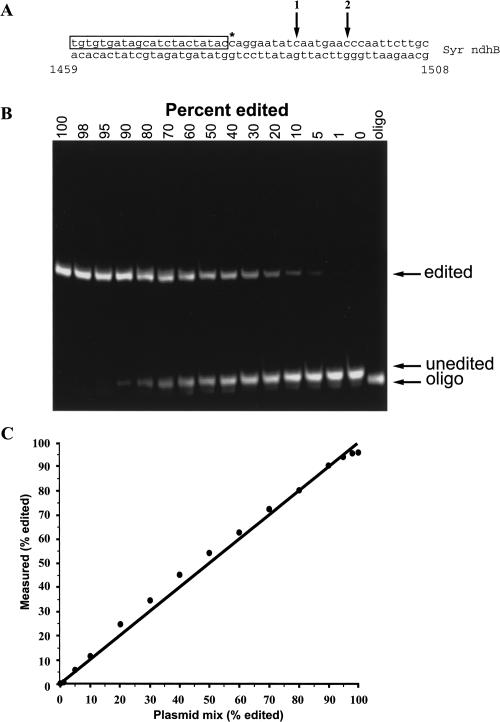
Accuracy of the assay on known template mixes. (A) Map of relevant Syr ndhB sequence used as a template for the assay. Primer sequence is boxed. Asterisk denotes editing site (C → U). Arrow 1 indicates the first instance of the terminator after the editing site (intended stop if editing site is edited). (B) Fluorescence scan of a polyacrylamide gel containing assay products of Syr ndhB plasmid templates. Plasmid clones of edited or unedited templates were mixed prior to PCR amplification to produce heterogenous templates for the assay. Numbers above the lanes indicate the percent of edited template in the mixture. (C) Quantification of the known template mix assay. The known ratio of edited to unedited plasmid is plotted against the values measured in the assay from B. The line represents the expected results if known and measured values are identical (y = x). The least-squares fit of the actual data is defined by the equation y = x + 3, F(1,14) = 2871, p << 0.001).

