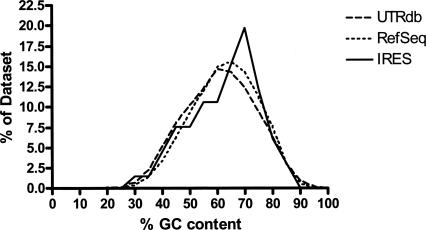
FIGURE 3.
The distribution of the % GC content of human 5′-UTRs. The degree of RNA folding and structure stability can be partially assessed by the percentage of possible G and C base pairing within the UTR sequence and therefore the percent of Gs and Cs within the sequence. The % GC content of mammalian UTRs with published IRES are compared to the human 5′-UTRs from UTRdb and RefSeq and show a similar distribution. Plotted values are grouped in bins of five.

