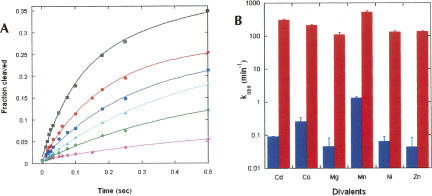
FIGURE 2.
Metal ion dependence of RzB cleavage on a millisecond timescale. (A) Reactions carried out at 37°C (pH 7.4) in 1 mM Mg2+ (pink diamonds), 1 mM Ni2+ (green plus signs), 1 mM Zn2+ (aqua triangles), 1 mM Co2+ (blue squares), 1 mM Cd2+ (red circles), and 1 mM Mn2+ (black squares). Calculation of k obs was achieved by fitting each time course (through the first 0.5 sec) to a single-exponential equation, except the one for Mn2+, for which a double-exponential equation was used. (B) Bar graph of kobs values for RzB (red) and RzB0 (blue). Reported error for RzB is the uncertainty of the fit of each plot and for RzB0 (Supplemental Fig. 2B) was calculated from duplicate data sets.

