
Fig. 1.
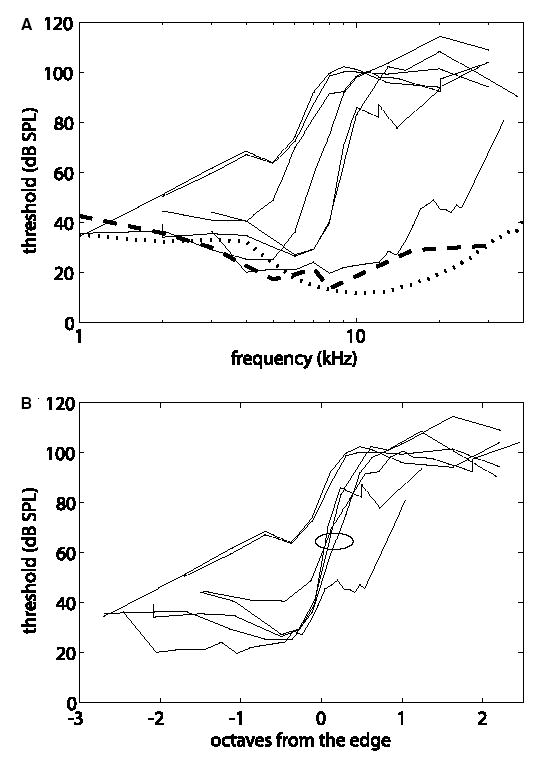
(A) CAP threshold functions for cats exposed to acoustic trauma (light solid lines), compared to thresholds from unexposed animals (dashed and dotted lines). CAP threshold is plotted versus frequency for CAPs studied at the beginning of each experiment. The heavy dashed line is from one unexposed animal studied in our lab; the dotted line is the average CAP audiogram from three animals reported by Rajan and Irvine (1998). (B) Threshold audiograms from the exposed cats shifted along the frequency axis to align the steepest portions of the audiograms. The abscissa is frequency relative to the steepest point, in octaves. The circle identifies four similar threshold functions; data from these experiments are shown separately in Fig. 4A.