
Fig. 2.
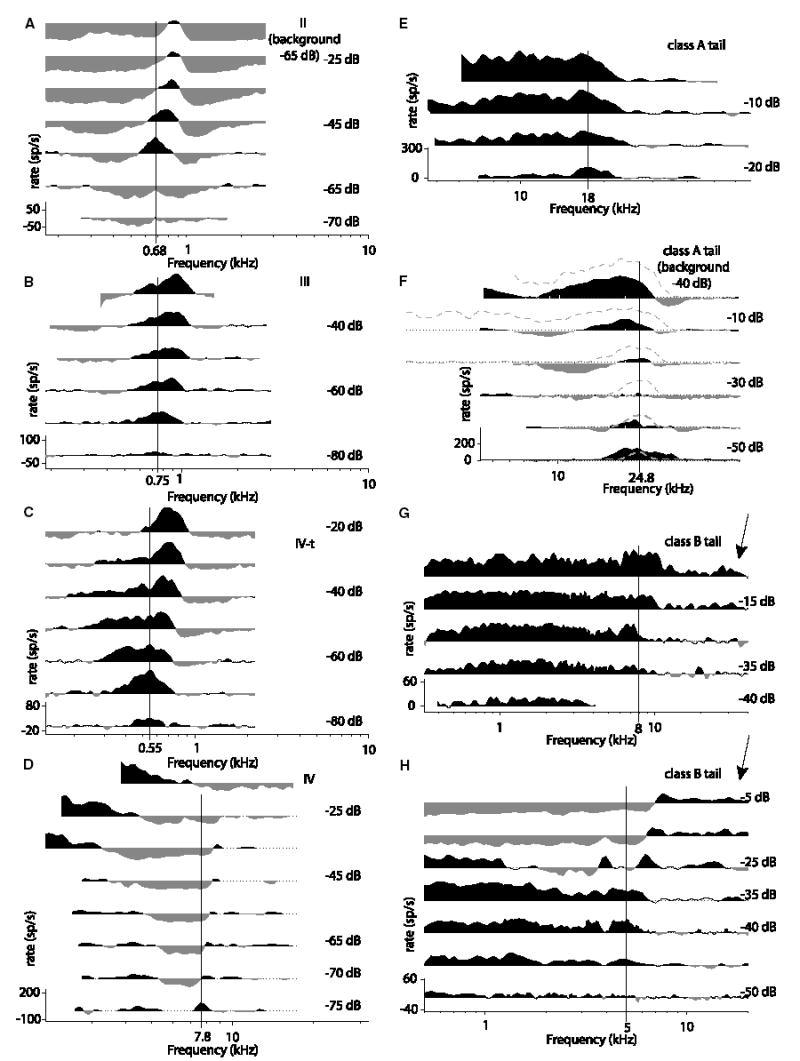
Response maps of DCN neurons typical of non-exposed (left column) and exposed (right column) animals. Response maps show discharge rate versus frequency at a succession of fixed attenuations (the sound level at 0 dB attenuation is approximately 100 dB SPL). The horizontal lines are spontaneous rate or background rate in two-tone maps. The vertical solid lines show the BFs assigned to the neurons. Regions colored black are excitatory, meaning an increase in rate over spontaneous, and regions colored gray are inhibitory, meaning a decrease in rate. The maps are based on responses to one repetition of a 200 ms tone, so should be interpreted qualitatively. They have been smoothed with a three-point filter. For neurons without spontaneous activity, two-tone response maps are shown (A and F). In these cases, a second tone a few dB above threshold at the BF of the neuron was presented along with the response-map tone. The second tone produces enough background activity that inhibitory responses can be seen. (A) Type II two-tone map (the second tone was 0.68 kHz at −65 dB, 36 dB SPL).(B) Type III map. (C)Type IV-T map. (D) Type IV map. (E)Class A tail response map showing no clear inhibition for a neuron with spontaneous activity. (F) Class A tail response map showing inhibition; both single-tone (dashed line) and two-tone (filled map) response maps are shown. the horizontal line is the spontaneous rate (zero) for the single-tone map and is the driven background rate for the two-tone map. The second tone was 24.8 kHz at −40 dB, 72 dB SPL. (G) Class B tail response. Note the low level of activity extending to high frequencies at the highest level (arrow). (H) Class B tail response with inhibition.