
Fig. 4.
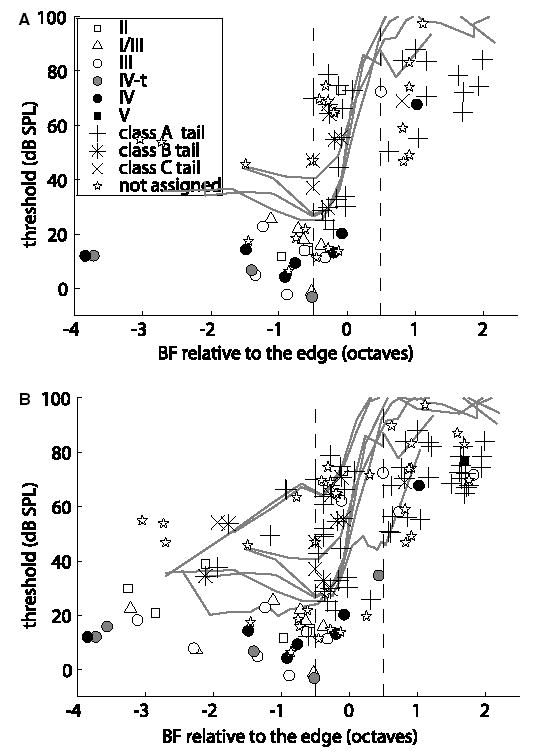
(A) Threshold at BF versus BF, plotted as octaves relative to the edge of the threshold shift. In most cases, thresholds were obtained from rate versus level functions for BF tones in 1 dB intensity steps. Only data from the four experiments with similar sharp threshold shifts, circled in 1B, are shown. CAP threshold audiograms are plotted in light gray. Symbols define different response map types, defined in the legend. “not assigned” means neurons in which the BF could be determined, but the response type could not. The dashed lines mark the edge region, from −0.5 to 0.5 octave relative to the steepest point on the threshold functions. (B) The same plot using data from all seven animals.