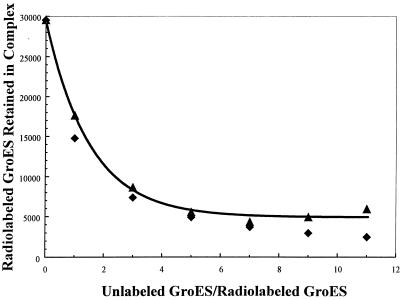
Figure 2.
Exchange of bound radiolabeled GroES7 as a function of added unlabeled GroES. Plot shows radiolabeled GroES7 retained in GroES7–GroEL14 complex vs. the ratio of added unlabeled GroES to radiolabeled GroES7. The initial sample contained 0.34 μM GroEL14 and 1.7 μM radiolabeled GroES7 in the same buffer as in Fig. 1. The abscissa gives the ratio of added unlabeled GroES7 over the initial radiolabeled GroES7. Units of the ordinate are counts from the PhosphorImager output. Electrophoresis was performed as in Fig. 1, and the radiolabel was quantified as described in Materials and Methods. Actual data are represented by ▴; theoretical expectations for isotopic equilibration are represented by ⧫. The line is an exponential fit to the data.

