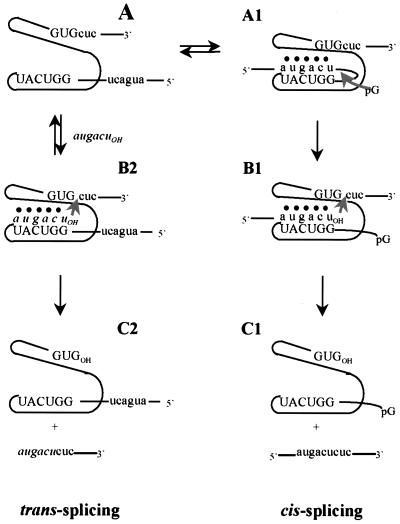
Figure 2.
Schematic representation of the self-splicing (cis-splicing) and trans-splicing reactions. The self-splicing reaction follows the pathway A → A1 → B1 → C1. The trans-splicing reaction follows the pathway A + augacuOH → B2 → C2. Steps B → C are shown as irreversible because of the low concentration of the spliced products. The upper case letters and intervening line represent the group I intron; the lower case letters and terminal lines represent the 5′ and 3′ exons; the italicized lower case letters represent the exogenous N3′ → P5′ phosphoramidate hexanucleotide; ● represents tertiary interactions with the intron’s catalytic core. The internal guide sequence is 5′-GGUCAU-3′. The reaction product monitored depends on the position of the radiolabel; 5′ labeled hexamer monitors the trans-spliced products, internal labeled precursor monitors products containing intron, and 3′ end-labeled precursor monitors products containing 3′ exon.

