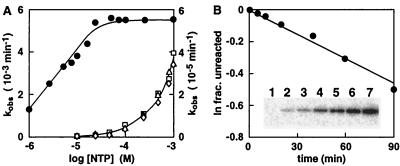
Figure 5.
Kinetic analysis of an improved ATP-dependent deoxyribozyme. (A) Rate constants exhibited by NTP-A2.1 with different concentrations and forms of NTPs. The left axis provides the scale for ATP (●), and the right axis provides the scale for GTP (□), CTP (▵) and UTP (⋄). (B) Self-phosphorylation of NTP-A2.1 with [γ-32P]ATP. Unlabeled deoxyribozyme (0.25 μM) was incubated with selection buffer containing 10 μM ATP (spiked with a trace of [γ-32P]ATP) for 0, 5, 10, 20, 40, 60, and 90 min (lanes 1–7, respectively) at 23°C and examined by PAGE (see Inset). A plot of the natural logarithm of the fraction unreacted (determined by using the maximum extent of self- and T4 PNK-mediated phosphorylation) versus time provides a negative slope of 4.0 × 10⁻³⋅min−1, which reflects the rate constant of DNA self-phosphorylation. This value corresponds well with the rate constant determined by using the DNA ligation method (5.5 × 10⁻³⋅min−1; Fig. 5A).

