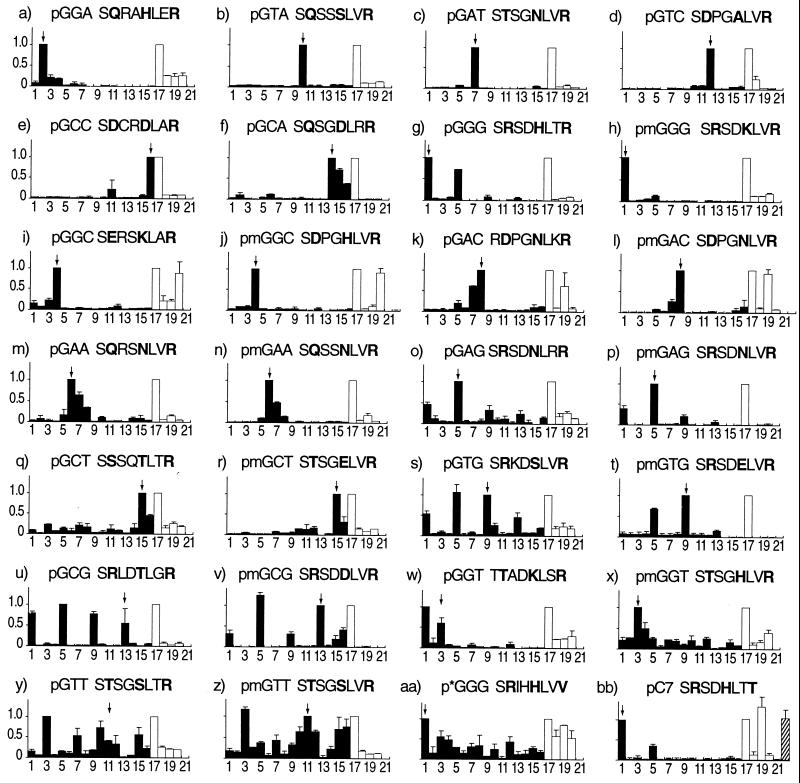
Figure 2.
Multitarget ELISA titration assay for binding specificity. At the top of each graph is the DNA finger-2 target site for which each protein was selected or designed, and the recognition helix of that protein (positions −2 to 6). Helix positions −1, 3, and 6 are in bold. Proteins modified by site-directed mutagenesis have the prefix “m” before their DNA target. Columns 1–16 (filled bars) represent target oligos with different finger-2 subsites: 1 = GGG; 2 = GGA; 3 = GGT; 4 = GGC; 5 = GAG; 6 = GAA; 7 = GAT; 8 = GAC; 9 = GTG; 10 = GTA; 11 = GTT; 12 = GTC; 13 = GCG; 14 = GCA; 15 = GCT; 16 = GCC. Columns 17–20 (empty bars) represent oligonucleotide pools with a unique 5′ nucleotide in their finger-2 subsite: 17 = GNN; 18 = ANN; 19 = TNN; 20 = CNN. (j) Column 22 = CGC. (i) Column 22 = TAC. (bb) Column 22 = TGG. All data are background subtracted (column 21 = no target oligo). The height of each bar represents the average normalized titer from two independent experiments, with the highest signal normalized to the greatest value in columns 1–16 and 17–20. Error bars represent the deviation from the average. An arrow indicates the position of the cognate target oligonucleotide.

