Figure 9.

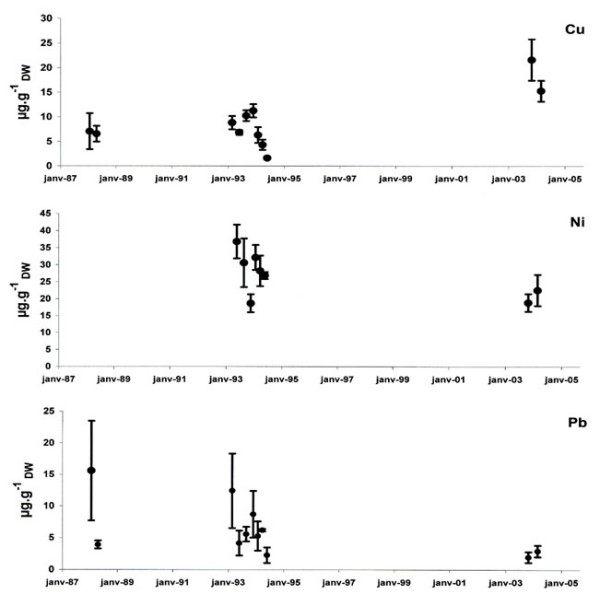
Metal concentrations in leaves between 1988 and 2004 in the Calvi area. Cu, Ni and Pb concentrations were expressed in μg gDW-1 (mean ± standard deviation).

Metal concentrations in leaves between 1988 and 2004 in the Calvi area. Cu, Ni and Pb concentrations were expressed in μg gDW-1 (mean ± standard deviation).