
Figure 2. Nadir and Post-Exercise Plasma Glucose Concentrations by Baseline Level (N=98 visits from 49 subjects).
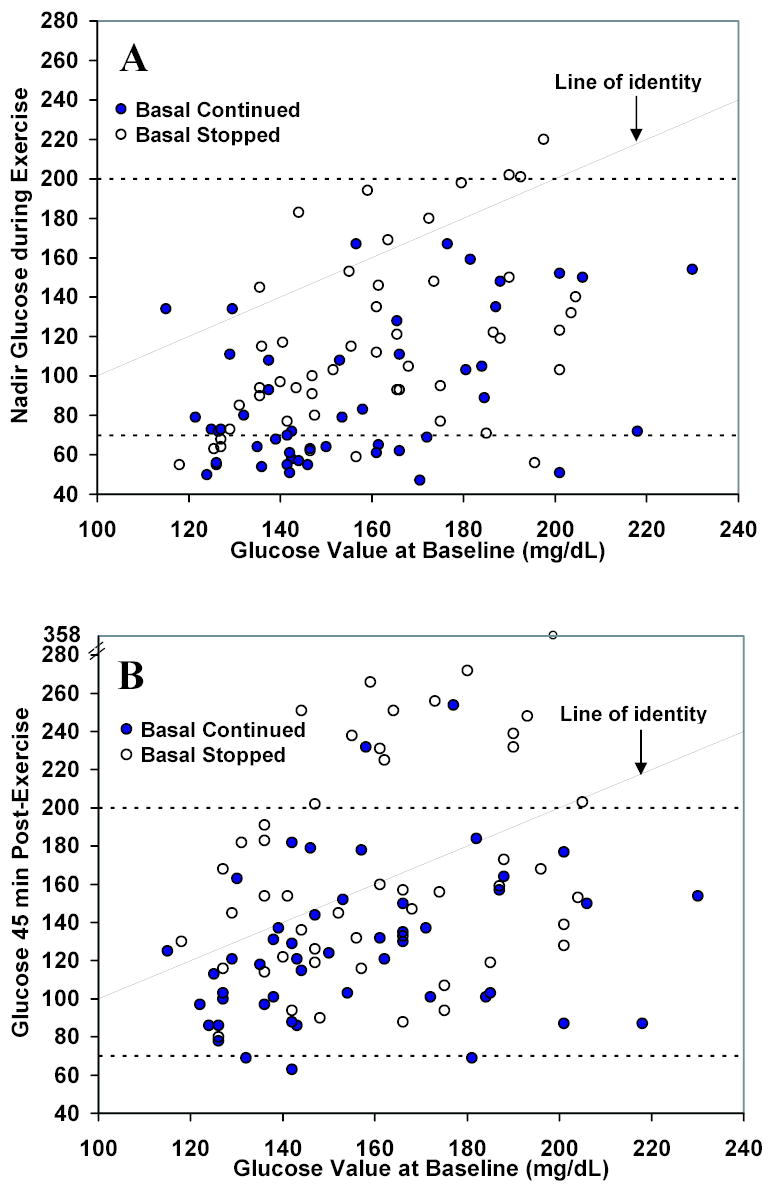
The nadir glucose concentration during exercise (A) and glucose concentration 45 minutes after completion of exercise (B) are shown by baseline level. Dashed lines denote the hypo- and hyperglycemia thresholds of 70 and 200 mg/dL, respectively. Note different scales on the horizontal and vertical axes.