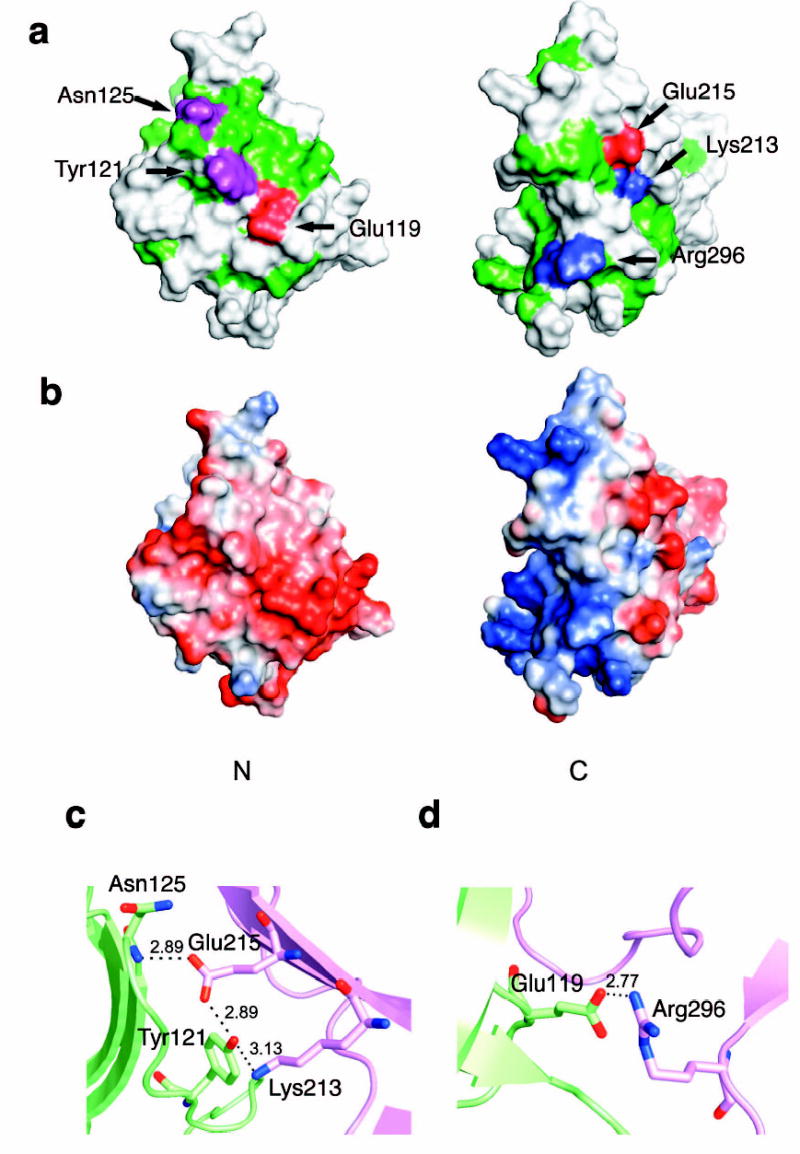
Figure 3. Polar core of Vps26.

(a) Polarity of the interface between two domains. Hydrophobic residues are colored in green, polar residues are colored in white. Acidic residues buried in the polar core are colored in red, uncharged residues involved in hydrogen bonding are colored magenta, and basic residues are colored in blue. (b) Electrostatic potential at the interface is colored with saturating blue and red at ± 5kT/e. (c) Residues contributing to the first cluster of polar interactions are shown in balls and sticks. Hydrogen bonds distances are in Å. N domain residues are colored in lime and C domain residues are colored in violet. (d) Residues contributing to the second cluster of polar interactions are shown in balls and sticks.
