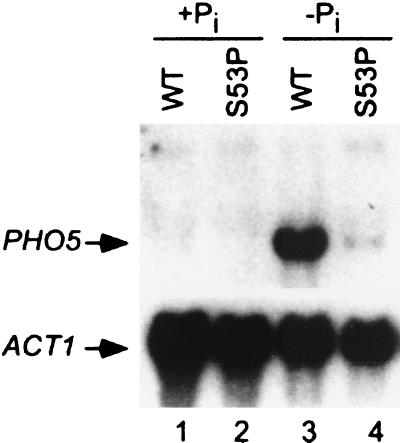
Figure 2.
Northern blot analysis of PHO5 expression. PHO5 transcript levels were determined in isogenic wild-type (WT) and S53P mutant strains grown under repressing (+Pi) or inducing (−Pi) conditions. ACT1 mRNA was used as an internal control. In the presence of inorganic phosphate (+Pi), PHO5 is fully repressed (lanes 1 and 2). In the absence of inorganic phosphate (−Pi), PHO5 is induced in the wild-type strain (lane 3), whereas induction is severely impaired in the S53P mutant (lane 4).

