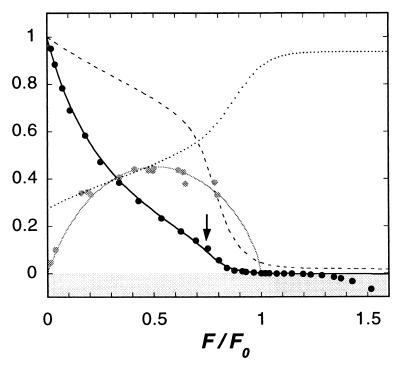
Figure 3.
Variation with load F of: the sliding velocity v/v0 (black line); the average fraction r of myosin molecules with a bound head (dotted line); and the ATP splitting rate V/V0 (dashed line). Parameter values as cited in the text. Also shown, the mechanical efficiency when ΔGstroke = −15 kBT (gray line). Black circles are Edman’s experimental measurements of velocity (Fig. 7 of ref. 9). Gray circles are Hill’s experimental measurements of mechanical efficiency (27). These results are the time-averaged velocity of an indefinitely long thin filament being propelled by a thick filament comprising N = 150 myosin molecules (total number of chemical reaction events = 108).

