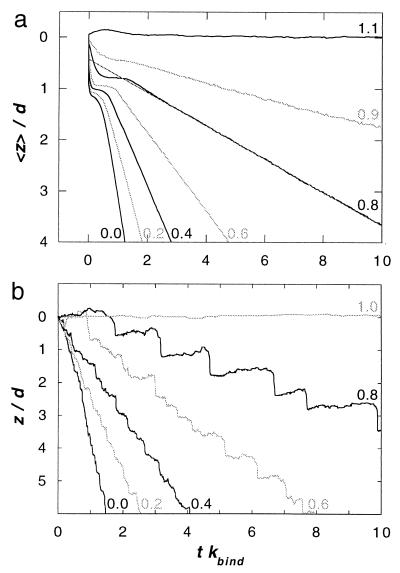
Figure 4.
(a) Average displacement <z> of the thin filament subsequent to an abrupt change of load, from F0 to F, at time t = 0. The transient response is averaged over 4,000 pairs of filaments, each linked by N = 150 myosin molecules. Curves are labeled by the value of F/F0. (b) Trace of the displacement z of a single thin filament, propelled by N = 150 myosin molecules, at various values of a steady load F. Curves are labeled by the value of F/F0.

