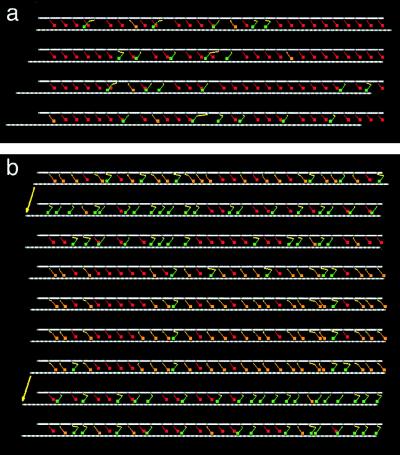
Figure 5.
(a) Sequence of snapshots of N = 30 motor proteins propelling a thin filament (lower white rod) toward the left at zero load. Myosin heads are colored according to their chemical state: red = detached, orange = A⋅M⋅ADP⋅Pi (primed head), green = A⋅M⋅ADP (post-power stroke head). Elastic elements are shown in yellow. The time interval between stills is 0.4/kbind. (b) Same, with the motion opposed by load F/F0 = 0.8. The arrows indicate two instants at which the power strokes of a large fraction of the heads occur almost simultaneously. For clarity of presentation, this figure was prepared by using a slightly modified model that incorporates discrete binding sites, separated by intervals of 5.5 nm on the thin filament. Discrete and continuum models yield almost identical results.

