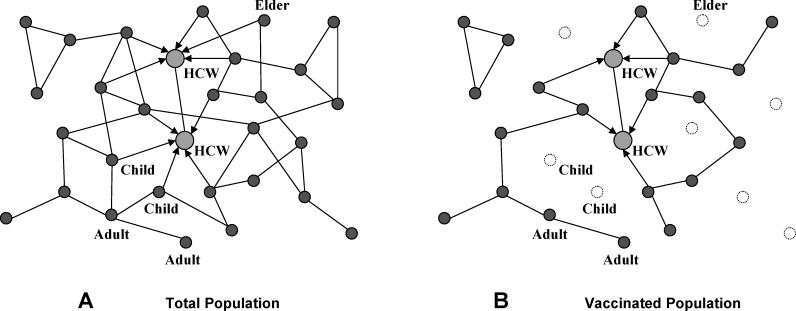
Figure 1. Network Model.
(A) A schematic of a network model for an urban population. Each individual is a vertex in the network, and edges represent potentially disease-causing contacts between individuals. Directed edges (with arrows) represent transmission occurring in only one direction.
(B) We model vaccination in a population by removing nodes from the population network, and the edges that are attached to them.
HCW, health-care worker.

