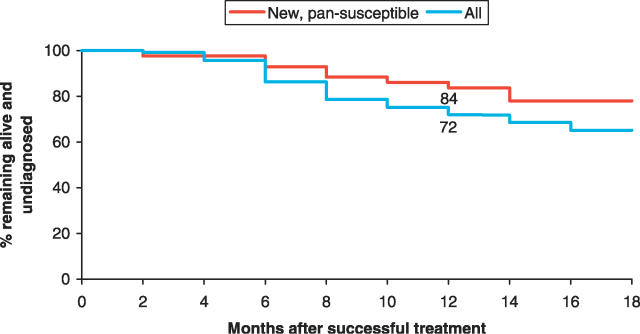
Figure 1. Continued Treatment Success over Time for New Pansusceptible Cases Compared to the Complete Study Sample.
Shown are cumulative percentages of successfully treated patients remaining alive and undiagnosed over time (life table method) for the complete study sample (n = 118) and for the subgroup of new, pansusceptible cases (n = 43). At 12 mo post-treatment 84% of new, pansusceptible cases were still alive and free of TB compared to 72% in the complete sample.

