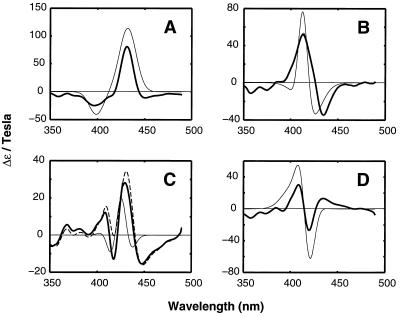
Figure 2.
Intermediate MCD spectra calculated from the heterogeneous kinetic mechanism in Fig. 3: (A) The aggregate five-coordinate species, cytMet* + cytHis* + cytU*, (B) cyt[Met–Fe–His], (C) cyt[His–Fe–His]*, and (D) cyt*-CO (A–D, dark lines). These were optimized to fit the spectra of corresponding model cytochromes (A–D, light lines); see text. Intermediate spectra calculated from a multiple-equilibria mechanism (Scheme S1) are shown for comparison (A–D, - - -) (These overlay the spectra from the heterogeneous mechanism in all panels except C.).

