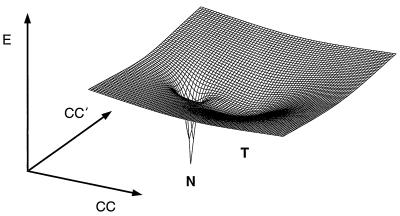
Figure 4.
Schematic diagram of the internal free energy (E) landscape for folding after cytochrome c-CO photolysis, cyt*-CO →hν cyt* + CO, as a function of protein configurational coordinates (CC). A folding funnel (N) and an overlapping local minimum (T), corresponding to the histidine-ligation trap, together form a surface topologically similar to the “moat” landscape of Dill and Chan (6) describing heterogeneous (fast and slow) folding kinetics.

