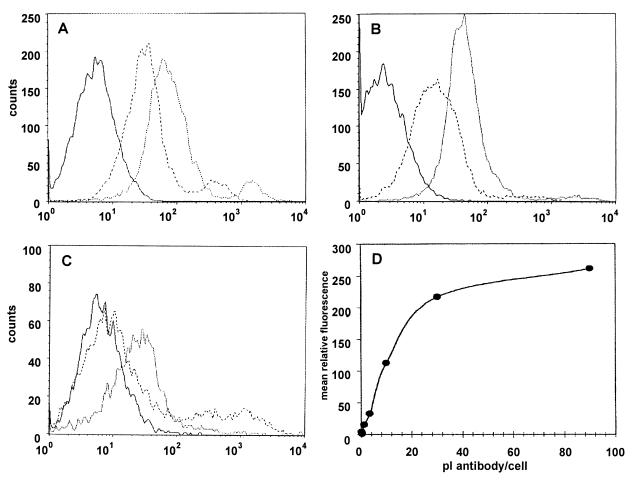
Figure 4.
Binding of antibody directed against the α-subunit of ATP synthase on the surface of HUVEC by flow cytometry. HUVEC were analyzed by FACScan flow cytometry as described in Materials and Methods. Histogram plots are shown for HUVEC (A) and A549 (B) where dotted lines represent cells incubated with antibody directed against the α-subunit of ATP synthase, dashed lines preimmune serum, and solid lines secondary antibody only. Histogram plot of A549 shown in C are similar with dotted lines representing antibody incubated with a 5-fold molar excess α ATP synthase protein. (D) HUVEC demonstrate specific, saturable binding of antibodies directed against the α-subunit of ATP synthase. The mean relative fluorescence of HUVEC incubated with preimmune rabbit serum subtracted from the mean relative fluorescence of HUVEC incubated with the same volume of anti-α ATP synthase gave the mean relative fluorescence resulting from the specific binding of antibodies directed against the α-subunit of ATP synthase on the HUVEC surface.

