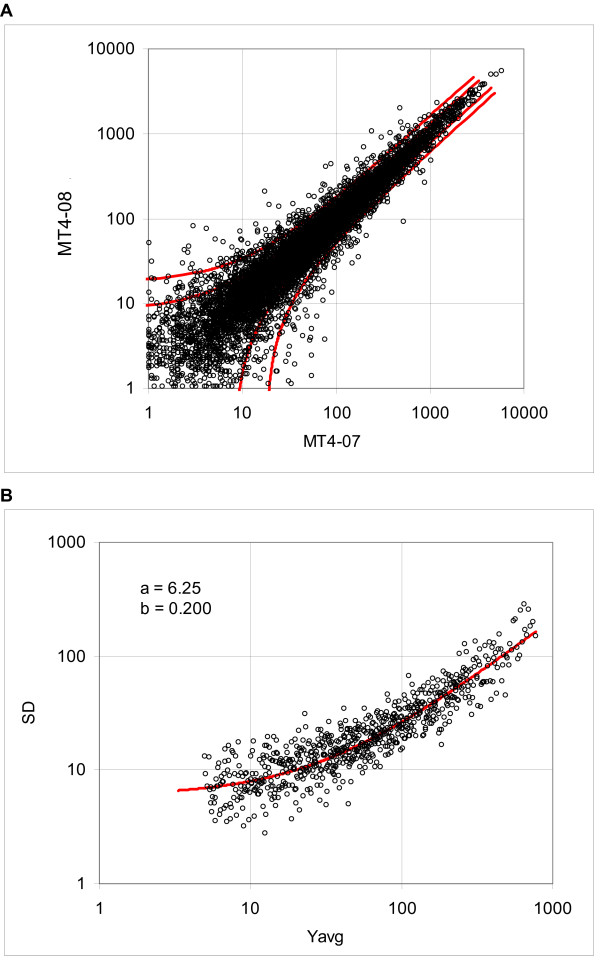
Figure 4.
Dispersion of the murine tissue data, array MG-U74Av2, samples MT4-07 and MT4-08. A. Dispersion plot and boundaries of the 0.8 and 0.95 probability intervals. B: Standard deviations calculated using the expression difference in consecutive samples and the regression curve (solid line), representing the standard deviation function (data Cosio).

