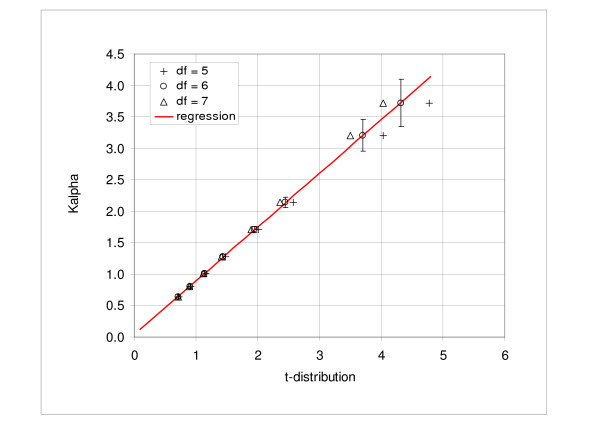
Figure 6.
Correlation of the Kα coefficients and inverse t-distribution. Figure shows the values of Kα coefficient correlated with the corresponding values of the t-distribution in the range of probabilities from 0.5 to 0.995. The adjusted R2 coefficient is 0.99993, intercept is 0.039 and the coefficient of proportionality is 0.855. The degree of freedom for the t-distribution is 6.

