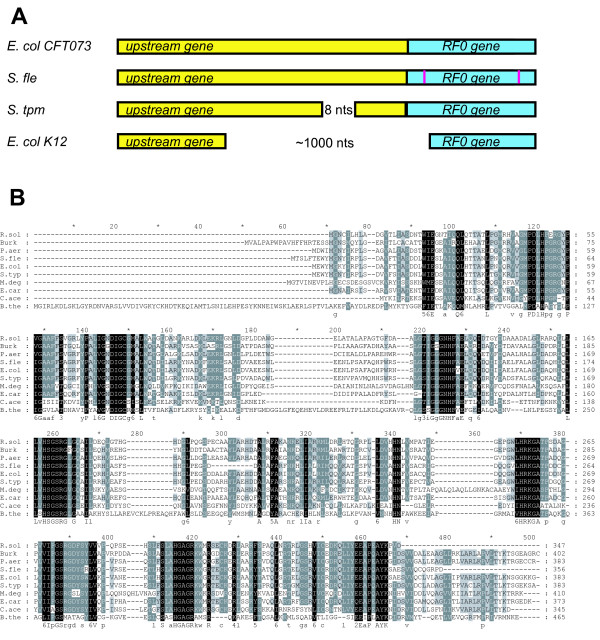
Figure 2.
Comparative schematic gene alignment of RFH operons and alignment of upstream gene. A. Schematic representation of disrupted ORFs among the sequences analyzed. The RFH gene and its upstream companion are shown as boxes. Deleted regions are shown as lines and the sizes of deletions are indicated. Nonsense mutations are shown by vertical purple lines. B. Sequence alignment of the upstream gene produced with ClustalW [23]. For abbreviations and accession numbers see legend to Fig. 1.

