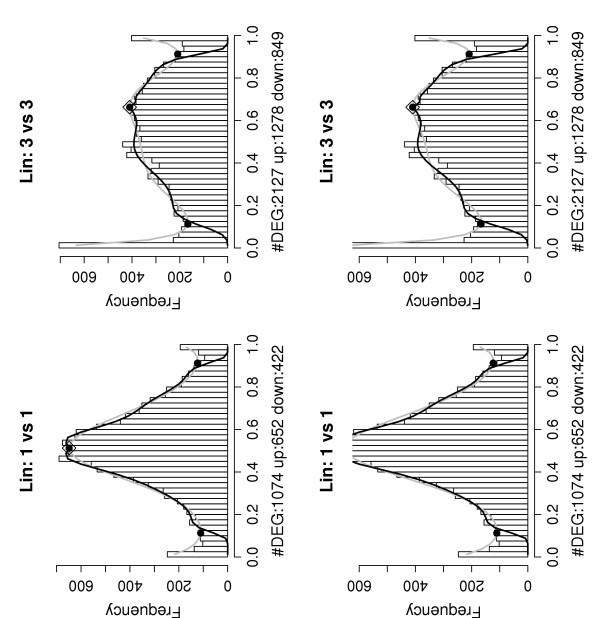
Figure 7.

Histograms of the P(dg < 0) values – Lin data set. Results shown are for the two arrays from mouse 1 at time points 14d and 23d (left) and from mice 1, 2 and 3 at time points 14d and 23d (right). Both analyses show an excess of P(dg < 0) values in the tails indicating the presence of both over- and under expressed genes.
