Figure 1.
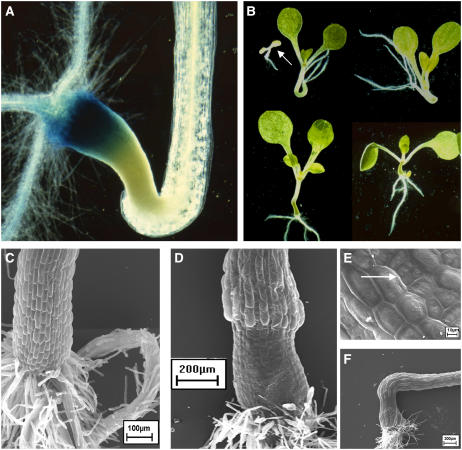
Phenotype of tnp seedlings. A, Root-hypocotyl junction of a 7-d-old tnp seedling showing GUS activity of the PLS promoter trap in the basal region of the abnormal structure. Magnification ×7. B, Seven-day-old tnp seedlings showing phenotypic variation. Arrow indicates seedling lethal phenotype. Magnification ×2. C, Scanning electron micrograph of the hypocotyl of a 7-d-old pls seedling. Bar = 100 μm. D, Scanning electron micrograph of the hypocotyl of a 7-d-old tnp seedling. Bar = 200 μm. E, Scanning electron micrograph of the tnp structure. Arrow indicates abnormal divisions in a cell file. Bar = 10 μm. F, Scanning electron micrograph of a tnp hypocotyl showing cell elongation above the structure. Bar = 200 μm.

