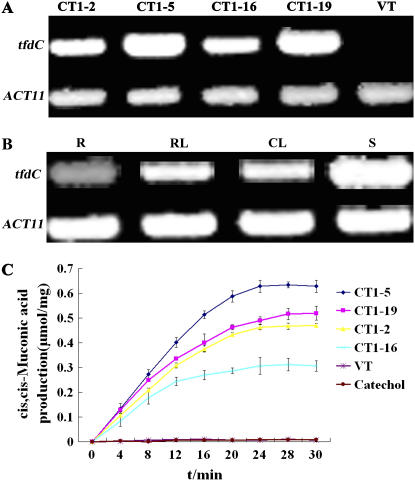
Figure 3.
Expression levels of tfdC and activities of TfdC in transgenic Arabidopsis. A, RT-PCR-amplified tfdC fragments from the plants of VT and CT lines (CT1-2, CT1-5, CT1-16, CT1-19) with ACT11 as a reference. B, RT-PCR-amplified tfdC fragments from roots (R), rosette leaves (RL), cauline leaves (CL), and stems (S) of the transgenic line CT1-2. C, Activities of TfdC in the VT and CT plants. Catechol, Added substrate catechol in the reaction mixtures but no crude enzyme. The data represent mean ± sd (n = 3).

