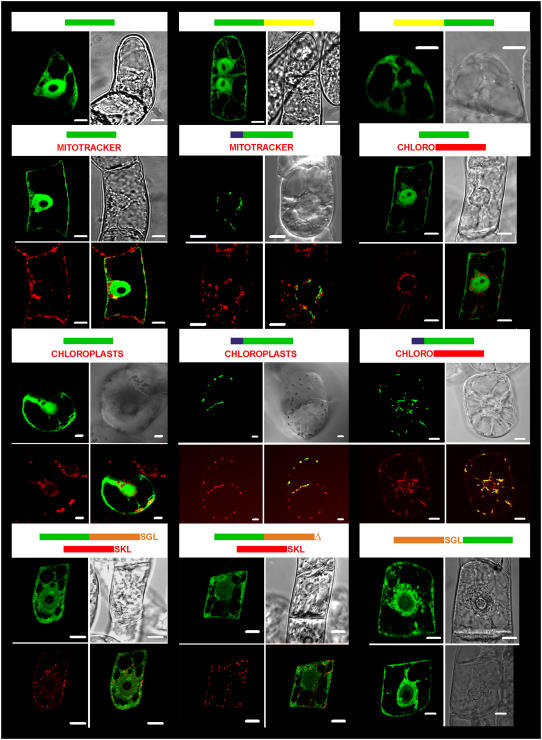
Figure 6.
Subcellular localization of At-XK isoforms fused to GFP. The constructs used for colocalization experiments are represented at the top of the pictures. Bars represent the gene contained in the construct used for bombardment experiments (green: gfp; yellow: Atxk-2; blue: Atxk-1 transit peptide; red: rfp; orange: truncated form of Atxk-1; chloro: coding for PT5-RFP targeting specially the RFP into chloroplasts). The truncated form of Atxk-1 was fused either with its C terminus SGL motif or without (symbolized by an orange triangle). Pictures, depicting 5- to 16-h-old cells after transformation of tobacco cv xanthi (containing chloroplasts) or cv Bright Yellow-2 cells (all other cases), are documented. Green pictures are representative of images recordings made with a LSL510 confocal microscope after excitation at 488 nm and recording of the emission between 505 and 530 nm (top right picture) for the detection of GFP. Red pictures are representative of acquisitions made after excitation at 543 nm and emission of the natural red fluorescence of chlorophyll or RFP. The bright-field image is represented in the top right picture. When indicated, the bottom right picture is a superposition of both green and red channels, which shows colocalization of the fusion protein with the red standard, if any. The white scale bars represent 10 μm.

