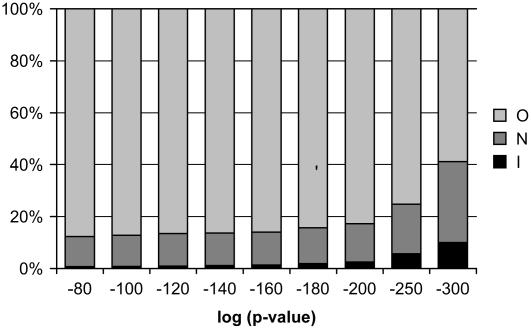
Figure 2.
Relative proportions of high-confidence coexpression links. Each column reports the relative numbers of coexpression pairs with p values indicated on the x axis, where the paired genes are both in the same AraCyc pathway (I), both are in different AraCyc pathways (N), or only one is in an AraCyc pathway (O).

