Figure 3.
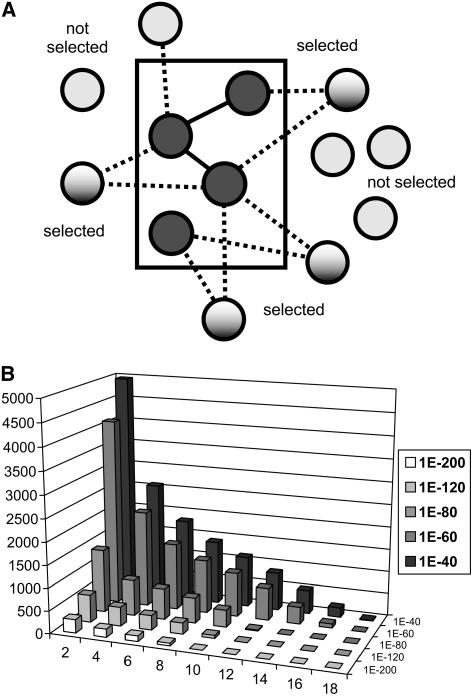
Coexpression network analysis. A, Schematic showing PLC analysis for identifying functionally relevant candidate genes outside a functional grouping (e.g. a metabolic pathway) using their connections to genes within the group. Bait genes that are members of the same functional group (rectangular area) are connected via coexpression relationships (dotted lines) to genes not currently annotated as belonging to the group. Some of the genes outside the group are connected to more than one group member and are selected as candidates for further analysis. B, Numbers of coexpressed genes selected under different coexpression p value cutoffs (ranging from 1E-40 to 1E-120) or requiring increasingly large numbers of coexpression partners within a pathway (2–15). No gene pair is counted more than once per column.

