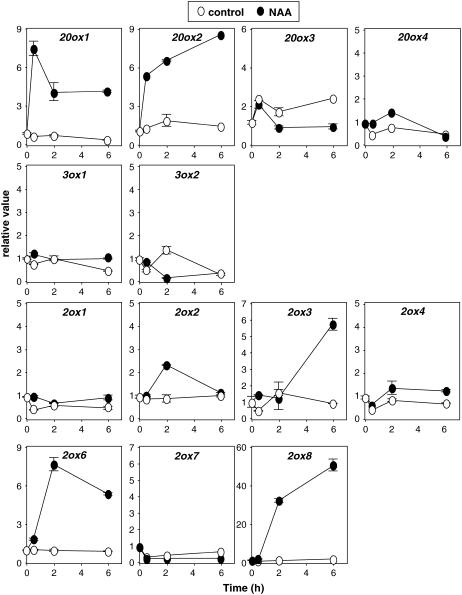
Figure 3.
Time course of auxin up-regulation of GA metabolism genes. Six-day-old wild-type Col-0 Arabidopsis seedlings were treated with 50 μm NAA or mock treated for the indicated times. Transcript levels of GA metabolism genes were analyzed as explained in the Figure 1 legend. Transcript level at time point 0 was set to 1 for each gene, and all other values were calculated relative to this value. Error bars represent sd.

