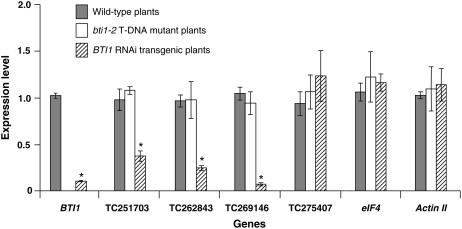
Figure 3.
Comparison of the expression levels of BTI1 and some of its potential off-targets in wild-type, bti1-2 mutant, and BTI1 RNAi transgenic Arabidopsis plants. Initiation factor-4 (eIF4) and actin II genes were used as controls to show equal loading. Error bars are the sds of three biological replicates of quantitative RT-PCR. *, Expression level of the gene in the BTI1 RNAi transgenic line is significantly lower than that in the wild-type or bti1-2 mutant plants with 98% confidence by t test.

