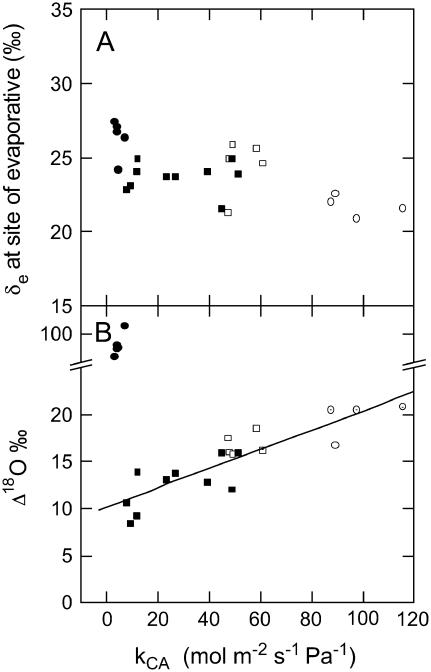
Figure 2.
The isotopic composition (‰) of the water at the site of evaporation (δe) and the oxygen isotope discrimination (Δ18O) as a function of the rate constant of leaf CA (kCA mol m−2 s−1 Pa−1). Values of δe were calculated as described in the text using Equation 1 and source water (δs) was −5.3 ± 0.3‰. The line represents a linear regression (R2 = 0.87) for all data except the plants with high Δ18O values. Symbols and gas exchange conditions are as in Figure 1 and δ values are expressed in reference to VSMOW.

