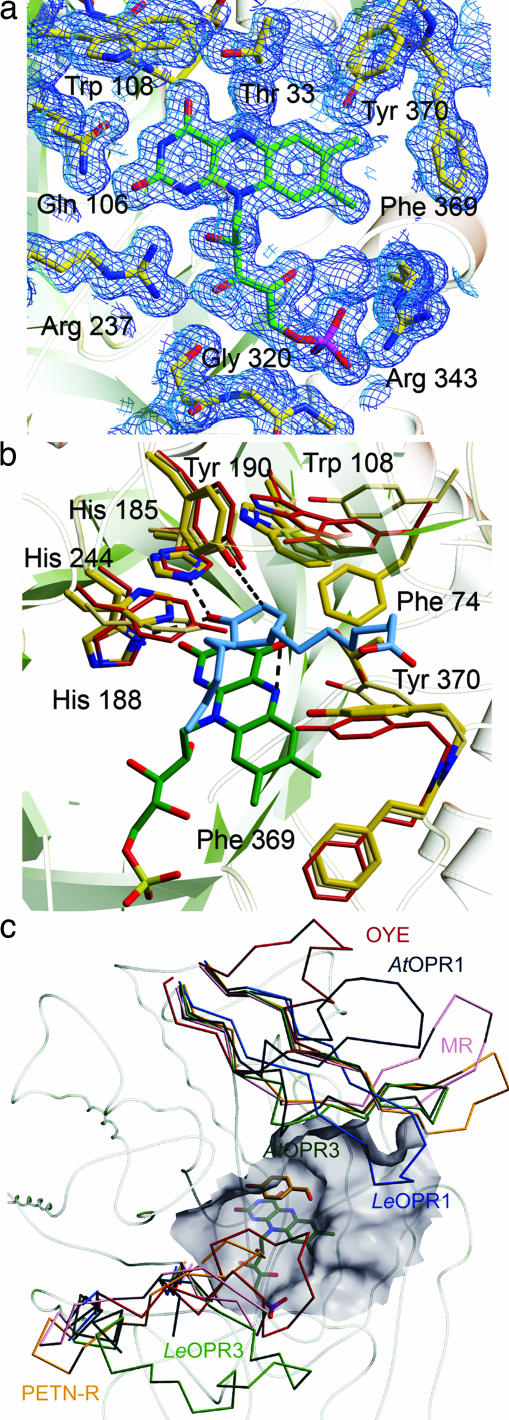
Fig. 3.
Active site of OPR3. (a) FMN-binding site. FMN (green) and amino acids that contact the FMN (yellow) are shown as stick models. The 2Fo − Fc electron density map is calculated at 1.5 Å and contoured at 1.0σ. (b) Superposition of the substrate-binding pockets of OPR3 (yellow), OPR1 (red), and OYE (beige). In addition, the FMN of OPR3 (green) and the OPR1 substrate 9R,13R-OPDA (blue) are shown to visualize interactions that are essential for catalysis. (c) Cα backbone of OPR3 and superimposed L3 and L6 loops of members of the OYE family. LeOPR3, light green; AtOPR3, dark green, LeOPR1, blue; AtOPR1, dark blue; OYE, red; morphinone reductase (MR), magenta; pentaerythritol tetranitrate reductase (PETN-R), yellow. In addition, the surface of the substrate-binding pocket of OPR3 and p-hydroxy benzaldehyde complexed to OYE are shown.

