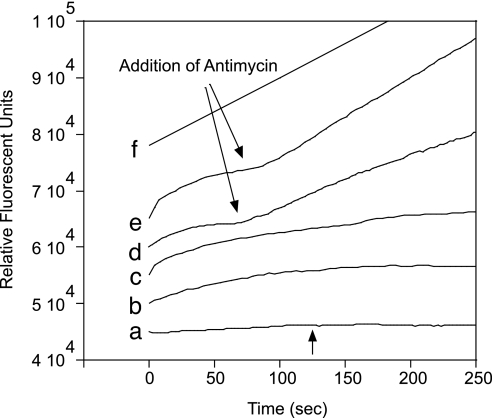
Fig. 3.
The fluorescence emission of isolated mitochondria incubated with Mito-HE. Each trace was evenly plotted above the previous one for clarity, and the rate of Mito-HE oxidation was calculated from the approximately linear slope of the first 60 sec. (a) Mito-HE (0.8 μM) incubated without mitochondria did not show an increase in fluorescence at λex = 396 nm, even upon the addition of 15 μM antimycin (arrow). (b) Fluorescence using λex = 396 nm of mitochondria respiring in State III with 0.8 μM Mito-HE. (c) Fluorescence using λex = 510 nm of mitochondria respiring in State III with 0.8 μM Mito-HE. (d) The same as b with λex = 396 nm with the addition of 15 μM antimycin (arrow). (e) The same as d, except λex = 510 nm. (f) Mito-HE (0.8 μM) without mitochondria was oxidized by xanthine/xanthine oxidase (generating 7.2 nM O2•− per sec) in the presence of 50 μg of DNA. The plotted curves represent 3–10 replicates of each experiment. Ethanol alone had no effect.

