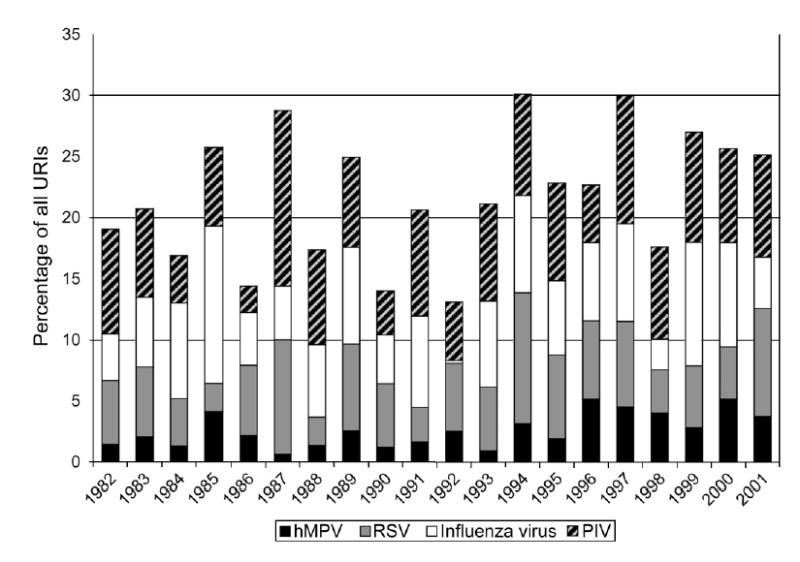
Figure 2.

Annual rates of human metapneumovirus (hMPV) and other virus infections from 1962 to 2001 in the Vanderbilt Vaccine Clinic. The Y-axis shows the percentage of all upper respiratory tract infections (URIs) during the year accounted for by each virus. PIV, parainfluenza virus; RSV, respiratory syncytial virus.
