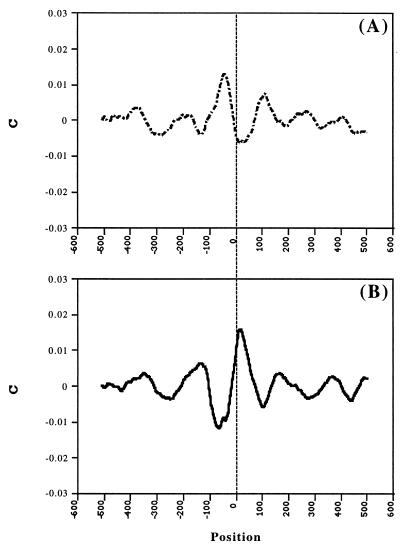
Figure 5.
C smoothed by 51 points running average for LEDB database. (A) Subset 1 (312 sequences). (B) Subset 2 (361 sequences). The subsets were picked according to preferential contribution of the sequences to one of the main peaks at −43 and +18 in Fig. 4. The results for the EPD sequences are similar (not shown).

