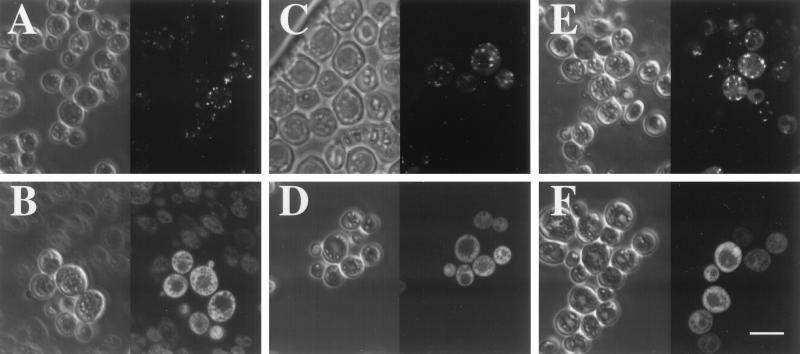
Figure 1.
Subcellular distribution of selected PTS1 candidate proteins. Confocal phase contrast and fluorescence microscopy of: (A) a wild-type and (B) a pex3 strain expressing the GFP–YIR034C (LYS1) fusion protein; (C) a wild-type and (D) a pex3 strain expressing the GFP- YDR234W (LYS4) fusion protein; (E) a wild-type and (F) a pex3 strain expressing the GFP–YGL184C fusion protein. The left side of each panel shows the phase contrast image of the yeast cells and the corresponding fluorescence image is shown on the right side of each panel. (Bar = 5 μm.)

