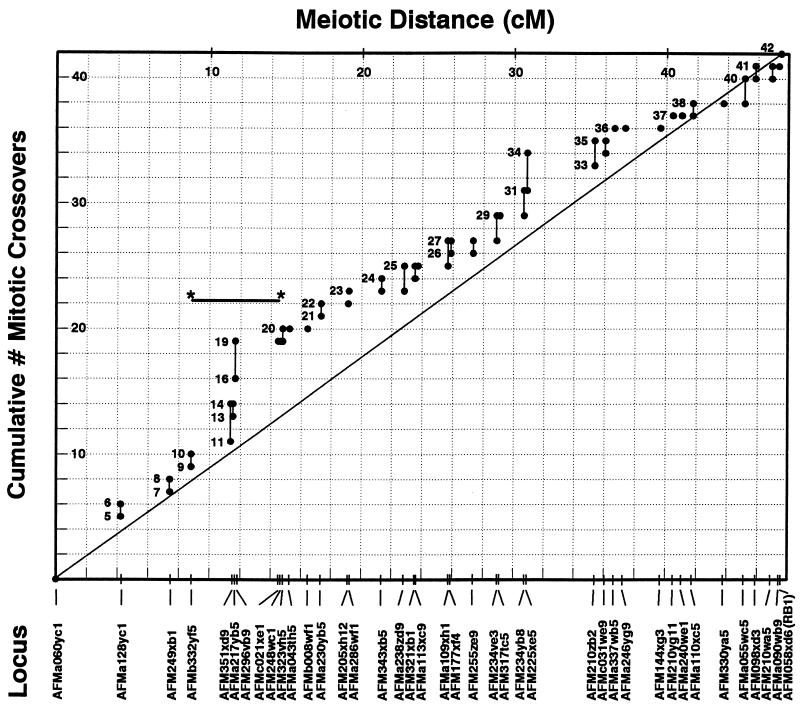
Figure 2.
Cumulative number of mitotic crossovers detected in the recombination cases in the interval AFMa060yc1 to RB1 as a function of meiotic recombination distance. The data are derived from 42 recombination events detected in the 34 recombination cases (30 with a single detected crossover event and four with three crossovers each). Marker names are spaced along the x axis according to published meiotic recombination distances. The solid diagonal line indicates the expected results if the relative propensities of defined chromosomal regions for mitotic recombination match those for meiotic recombination. Data for each marker are displayed as a range because of uncertainty arising from uninformative markers. The lower boundary of each range is the minimum number of crossovers that definitely occurred between the most proximal marker (AFMz060yc1) and that locus, and the upper boundary is the maximum cumulative number of crossovers that might have occurred. The region exhibiting a cluster of crossovers discussed in Results (between markers AFMb332yf5 and AFMc021xe1) is denoted with a horizontal line with asterisks. Two pairs of markers (AFM205xh12 and AFMa286wf1, and AFM234yb8 and AFM225xe5) that previously were assigned to the same genetic location were ordered in this analysis by observing an informative mitotic recombination event.

