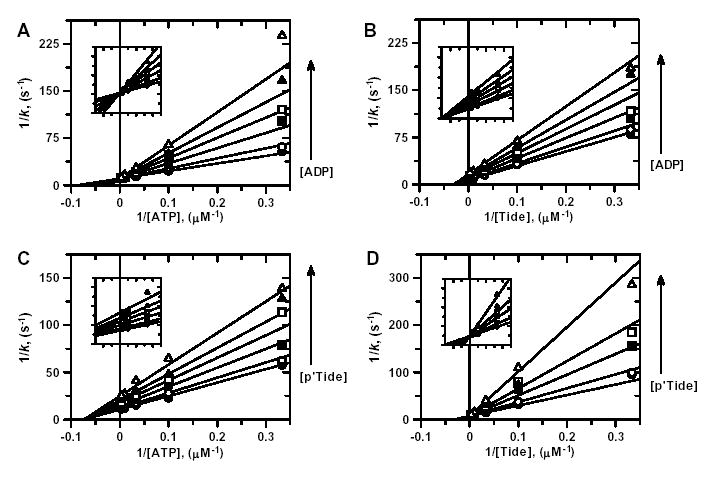
Figure 3. ADP and pTide Inhibition Kinetics.

Double reciprocal plots for A, ADP inhibition when ATP is the varied substrate; B, ADP inhibition when Tide is the varied substrate; C, pTide inhibition when ATP is the varied substrate; and D, pTide inhibition when Tide is the varied substrate. For all plots, indicated substrate concentrations were varied at six different concentrations of the indicated inhibitor [0 μM (•), 1 μM (○), 3 μM (▪), 10 μM (□), 30 μM (▴), and 100 μM ( ▵)], while the concentration of the other substrate was fixed at 30 μM. Solid lines represent fits of the data to the equation for either competitive inhibition (A, D) or noncompetitive inhibition (B, C).
