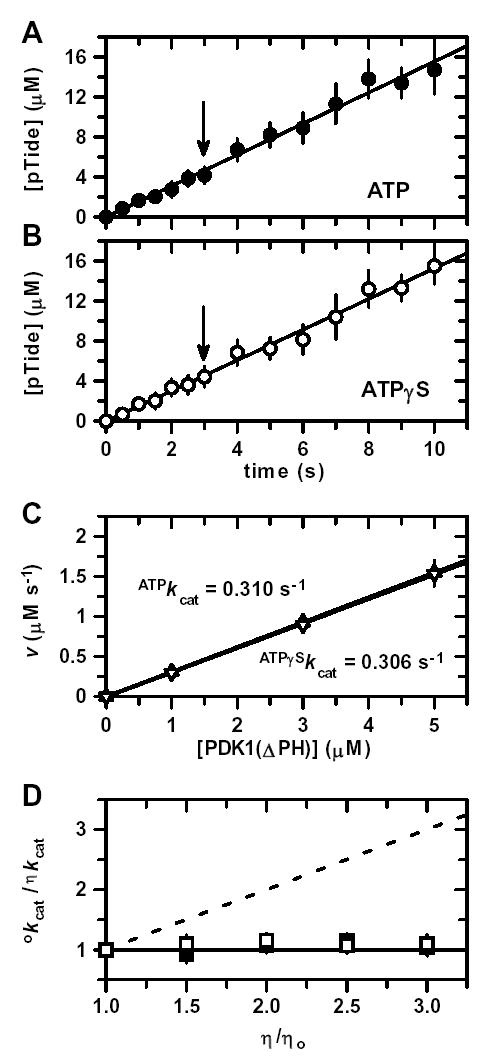
Figure 5. Pre-Steady-State Thio-Substitution and Solution Viscosity Effects.

Time progress for pTide formation under ‘saturating’ or kcat conditions using 5 μM enzyme, 300 μM PDK1-Tide phosphate acceptor, and either A, 300 μM ATP as phosphate donor (•) or B, 300 μM ATPγS as thio-phosphate donor (○). Solid lines represent linear fits of the time courses. Since no ‘burst’ or ‘lag’ phenomena were observed, the slopes of these lines yield initial velocities under pre-steady-state conditions. Arrows indicate the common time point at which the concentration of the pTide product equals the given enzyme concentration (i.e., transition point between single and multiple turnovers). C, Plot of pre-steady-state initial velocities, v, versus enzyme concentration (1, 3, and 5 μM) using either ATP (▴) or ATPγS (▿). Solid lines represent linear fits to yield apparent first-order ATPkcat and ATPγSkcat values. D, Plot of relative kcat values, οkcat/ηkcat, versus relative solution viscosity, η/ηo, using either ATP (▪) or ATPγS (□). The solid and dashed lines are drawn for slopes of zero and one, respectively. Bars indicate ±S.E.
