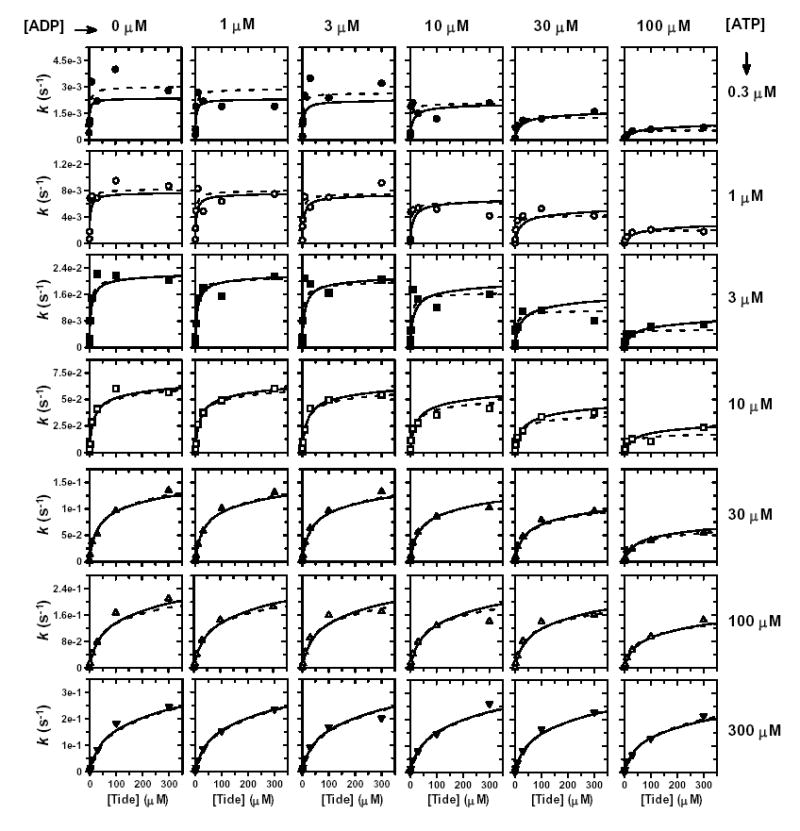
Figure S3. ADP Product Inhibition (Vary Tide).

Individual direct plots of k versus [Tide]. The concentration of Tide was varied at six different concentrations of ADP. ADP inhibition studies were carried out at seven different concentrations of ATP [0.3 μM (•), 1 μM (○), 3 μM (▪), 10 μM (□), 30 μM (▴), 100 μM (▵), and 300 μM (▾)]. Dashed lines indicate direct fits of each row of individual data sets to the general velocity equation for noncompetitive inhibition, which yielded values of appkcat, appKmATP, and appKiADP. Solid lines indicate the global fit of these data to Equation 6, which describes a Rapid Equilibrium Random Bi Bi system with a E-ADP-Tide dead-end ternary complex (Fig. 4G).
