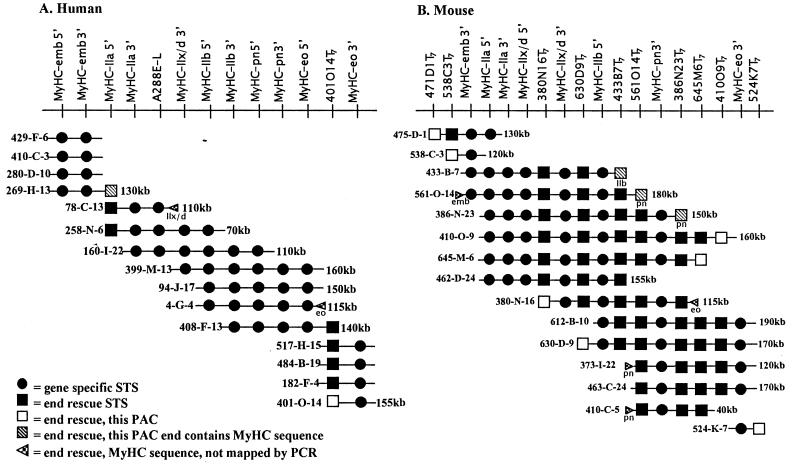
Figure 1.
Physical maps of skeletal MyHC gene clusters. The top line in each map shows the order of markers (listed in Table 1) established by STS content mapping of PACs aligned below. PAC names and sizes (if determined) are indicated at the left and right ends of PACs, respectively. MyHC genes identified in end rescue sequences (hatched symbols) are indicated below symbol. Spacing of markers does not reflect actual scale.

