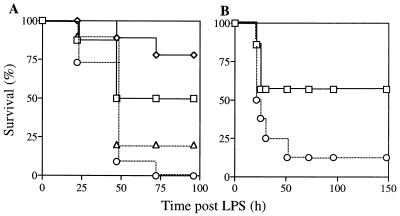
Figure 5.
CyCAP-deficient mice are more sensitive to LPS. (A) CyCAP +/+ and CyCAP −/− (E14-159 line) mice were injected i.p. with LPS. (Squares) CyCAP +/+ mice (n = 8) injected with 10 μg/gbw LPS. (Diamonds) CyCAP +/+ mice (n = 9) injected with 7.5 μg/gbw LPS. (Circles) CyCAP −/− mice (n = 11) injected with 10 μg/gbw LPS. (Triangles) CyCAP −/− mice (n = 10) injected with 7.5 μg/gbw LPS. Survival was compared by using the Mantel–Cox log rank test. For the 10-μg/gbw dose, P = 0.0209; for the 7.5-μg/gbw dose, P = 0.0093. (B) LPS challenge of an independently derived CyCAP-deficient line (E14-274) with 10 μg/gbw LPS. (Squares) CyCAP +/+ mice (n = 7). (Circles) CyCAP −/− mice (n = 8).

