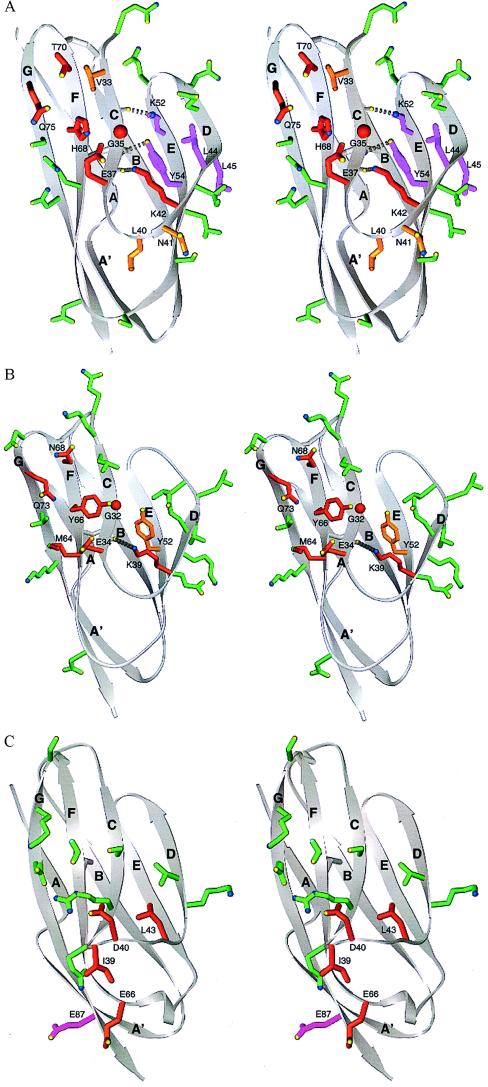
Figure 3.
Integrin binding surfaces in the crystal structures of domain 1 of ICAM-2, ICAM-1, and VCAM-1. Stereoviews are of ICAM-2 (A), ICAM-1 (B), and VCAM-1 (C). The backbone is shown in grey as a ribbon diagram (34) with β-strands lettered. Disulfide bonds are shown in gray. Side chains of individual residues tested by mutagenesis are shown as ball and stick. The carbons and bonds of these side chains are color-coded according to the percentage of wild-type binding to LFA-1 after mutagenesis (see Table 1 and Fig. 2 legend): red, <35%; yellow-orange, 35–70%; green, >70%; magenta, <35% with a possible effect on domain structure. Side chain oxygen and nitrogen atoms are yellow and blue, respectively.

