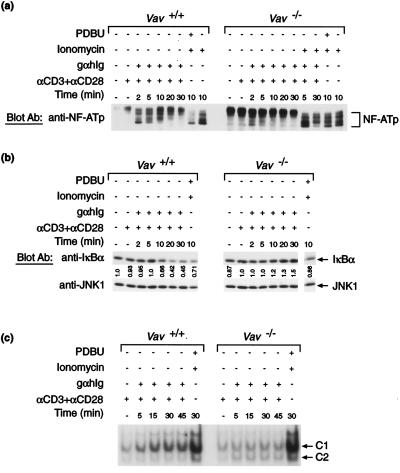
Figure 4.
NF-AT and NF-κB pathways in Vav−/− T cells. Immunoblot of cytoplasmic extracts of CD4+ splenic T cells stimulated as described in Fig. 2. In addition in some cases the cells were also stimulated with ionomycin (500 ng/ml) or phorbol 12,13-dibutyrate (PDBU; 10 ng/ml). (a) Immunoblot probed with an antiserum to NF-ATp. Dephosphorylation of NF-ATp results in a faster relative electrophoretic mobility and lower apparent molecular weight. (b) Immunoblot probed with an anti-IκBα antiserum and reprobed with an anti-JNK1 antibody to control for loading. Numbers below the IκBα blot represent relative amounts of IκBα normalized to JNK1 in each lane and to the amount of IκBα in the first lane (unstimulated Vav+/+ cells). Degradation of IκBα in TCR-stimulated Vav+/+ CD4+ T cells can be seen in the disappearance of the IκBα band. (c) NF-κB complexes visualized by electrophoretic mobility shift assay using 32P-labeled NF-κB probe bound to extracts from Vav+/+ or Vav−/− CD4+ splenic T cells. Based on data in the literature (24) and on our own experiments using anti-p50 and anti-p65 antibodies to supershift these complexes (data not shown), C1 contains both p50 and p65, whereas C2 contains p50, but not p65.

